 IMAS Metadata Catalogue
Environmental Management
Type of resources
Topics
Keywords
Contact for the resource
Provided by
Years
-
The GBR10 benthic habitat type map is the output of a modelling process that combines satellite imagery and other environmental attributes like water depth, slope and wave climate, along with known occurrences of benthic habitat type. The occurrences of benthic habitat type were derived through machine learning applied to geolocated photos of the benthos (>100,000 photos) that were collected along reef flats and reef slopes at various offshore shallow reefs (~100 reefs). The modelling process involves taking those occurrences of benthic habitat at known locations (training data) and using a machine learning model to build a relationship between benthic habitat type and the underlying data layers (imagery, depth, slope, waves). Because the data layers cover the whole Great Barrier Reef, a prediction is then able to be made for benthic habitat across the whole Great Barrier Reef as well. Contextual editing was then used to make changes to the map, based on a set of geomorphology- and ecology-based rules, such as what environment a class can occur in and what classes are able to neighbour each other (object-based rulesets). This map covers the “offshore” or “mid and outer-shelf” reefs of the Great Barrier Reef Marine Park. Some of the occurrences of benthic habitat type are withheld from the process, and used to check how well the mapping performed at the end (validation). The mapping was carried out by the Remote Sensing Research Centre at the University of Queensland. The scientific method for generating the benthic habitat map can be briefly described as: 1. Ingestion of Sentinel-2 satellite image data, bathymetry and wave climate data derived from Sentinel-2 image data, and various additional derived environmental covariates into Google Earth Engine 2. Stacking of the input data sources into a model-ready environment 3. Running a segmentation routine to create image objects 4. Fitting a supervised machine learning model (e.g. random forest) to known occurrences in order to classify segments into benthic classes 5. Application of object based rules using a range of colour, shape texture and relationship rules to modify the class attribution 6. Validation of mapping accuracy and performance This is an snapshot of the GBR10 benthic dataset taken on Jan 2023 for the Seamap Australia project from the GBRMP Reef Knowledge System (https://reefiq.gbrmpa.gov.au/ReefKnowledgeSystem), see also https://gbrmpa.maps.arcgis.com/home/item.html?id=492a87d95e8243728486718e7aed02a8. An updated version of the data may be available from the source provider.
-
Habitats serve a variety of functions on the North West Shelf (NWS). They support the life history stages of a diverse suite of tropical species including commercially harvested ones. In addition to natural disturbance regimes, habitats are altered in response to the sectoral uses, which in turn affects the distribution and life histories of species. Habitats thus serve as the nexus linking species with uses and natural disturbance, and different habitats serve different purposes at various stages of the life history of a species. A detailed understanding of habitats, at least at the structural level, is thus a prerequisite for a more comprehensive understanding of ecological structure and functions on the North West Shelf. This component of the North West Shelf Joint Environmental Management Study (NWSJEMS) aimed to collate and integrate data on habitats for the region of the North West Shelf extending from North West Cape to Port Hedland and from the coast to the 200 m isobath. The three main activities of the study were: Development of an integrated collection of information on habitats of the North West Shelf, including expert information; Application of the CSIRO Habitat Classification Framework to the data to determine the spatial nesting and structuring of habitat units on the North West Shelf; and Provision of the habitat structure classification for input into other models developed within NWSJEMS. This record describes data of key benthic marine ecosystems and habitats. These maps and descriptions of their component attributes were designed to assist the process modelling of the ecosystem and impacts of uses, as well as directly supporting planning and management by Western Australian agencies and industries.
-
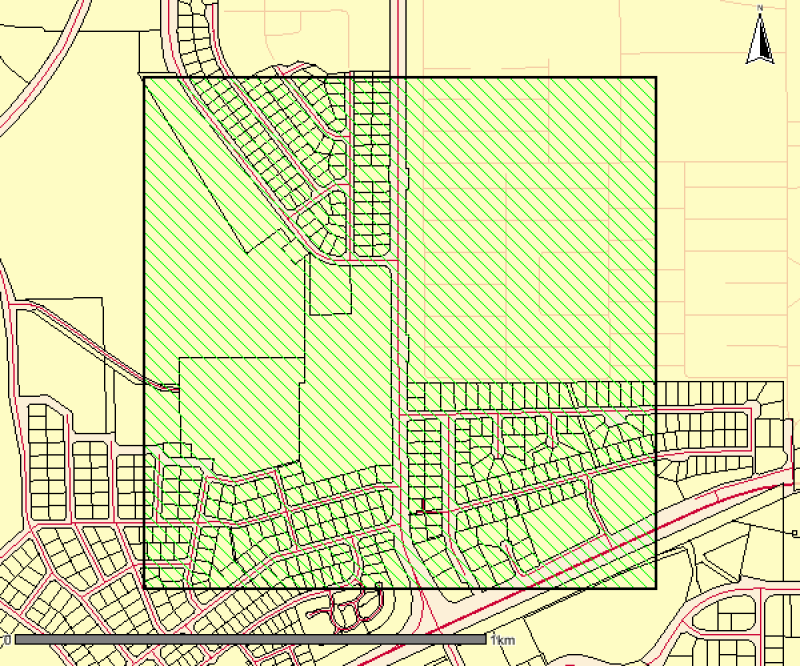
This polygon spatial dataset describes the benthic habitats likely to occur in marine environments around Gunn Point Peninsula and informs the desktop assessment of the marine biodiversity values for the region. The benthic habitats are inferred from existing information but in most cases require further data collection to validate and refine. Habitat modelling forms the basis of benthic community value assessment for Shoal Bay (Galaiduk et al. 2019). The accompanying report Marine and Coastal Biodiversity Assessment of the Gunn Point Area (2020) forms part of the Mapping the Future Project - Gunn Point. This project has identified land capability, water availability and biodiversity values to support land planning and inform development potential over the Gunn Point area. Reports and maps can be viewed from the webpage: denr.nt.gov.au/land-resource-management/development-opportunities - Development Potential of the Gunn Point Area (2020) - Biodiversity Assessment of the Gunn Point Area (2020) - Groundwater Resources of the Gunn Point Area (2020) - Marine and Coastal Biodiversity Assessment of the Gunn Point Area (2020) - Soil and Land Resources of the Gunn Point Area (2020) - Soil and Land Suitability Assessment for Irrigated Agriculture in the Gunn Point Area (2017) - Vegetation Communities of the Gunn Point Area (2020)
-
This spatial polygon dataset is derived from the 2001 mapping of mud crab (Scylla serrata) habitats along the NT and Queensland coastal wetlands. The polygons were derived from Landsat imagery and verified with field work and is suitable for use at scale 1:100,000. The information can be used in many ways to assist the management of these habitats. It provides a suitable baseline dataset for monitoring broad scale changes in area and composition of coastal wetland communities. Additionally, it provides information required by managers for choosing representative habitats for protection.
-
This is a collection of polygons outlining signficant seagrass meadows around Arnhem Land, Kakadu and Gulf of Carpentaria coastal waters for the Northern Australia Marine Biodiversity Survey (NAMBS) project between 2003 and 2005. Data was collected from imagery and ground truthed by observers from helicopter and insitu sample grabs.
-
This dataset provides mapping of water bodies and wetland regional ecosystems at 1:100,000 scale across Queensland.
-
This is a high resolution survey (1:5,000 scale dataset) describing mapped vegetation communities for the Ludmilla Creek catchment area (within the City of Darwin, Northern Territory). (Vegetation Unit - A reasonably homogeneous part of the land surface, distinct from surrounding terrain with constant properties in landform and vegetation) This vegetation survey was undertaken in 1996. This dataset represents the vegetation on the ground at the time of the survey and reflects the data and methods used to create the mapped polygons. The dataset has been revised in 2015 to include community descriptions but has not been updated to reflect the vegetation on the ground. The Darwin Remnant Vegetation Survey is considered a more up-to-date representation of vegetation for this area.
-
This dataset displays the reefs and shoals within Queensland maritime waters. The data has been compiled from numerous sources to produce a state wide coverage. Attributes within the data describe the source and reliability of the data. Data sources include: - The Great Barrier Reef Base Map - Geoscience Australia 1:250000 Topographic Mapping
-
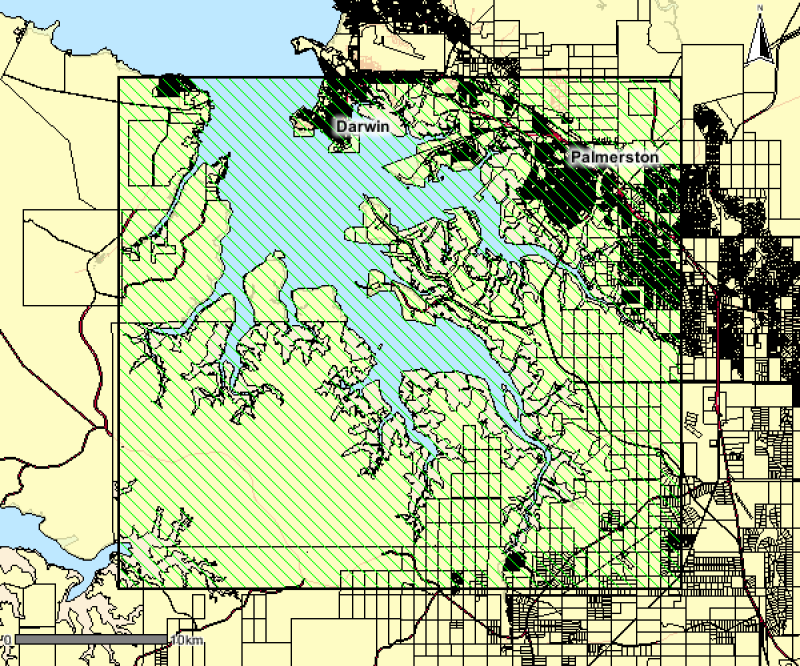
This polygon spatial dataset describes the mangrove communities for Darwin Harbour and its environs and was surveyed at a mapping scale of 1:25 000. The associated report notes an area of approximately 20,400 hectares of mangroves in Darwin Harbour and describes ten main mangrove associations or communities. The data provides a basis for identifying the extent and distribution of mangrove communities for Darwin Harbour and its environs.
-
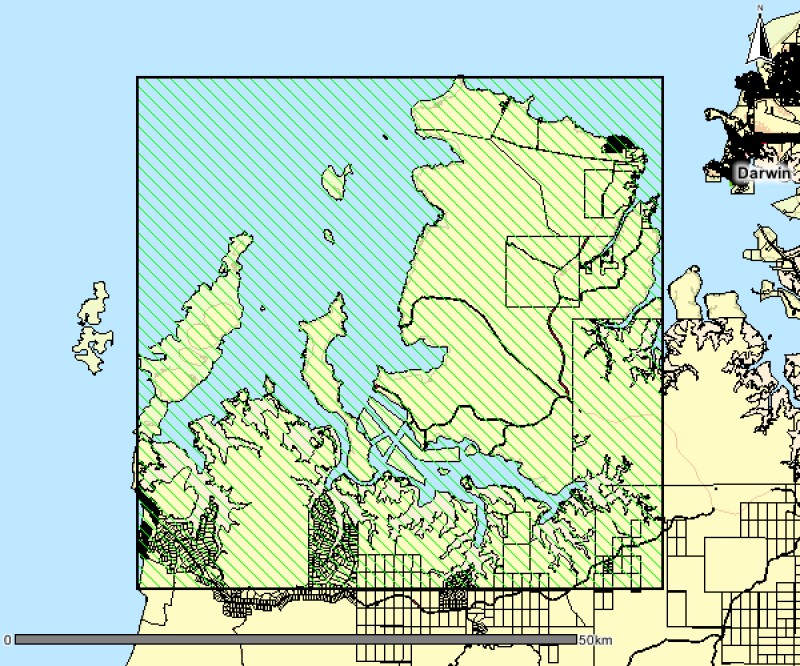
This polygon spatial dataset describes the mangrove communities for Bynoe Harbour and its environs. The original field survey was undertaken in 1998 at a mapping scale of 1:25,000. The associated report notes an area of approximately 24,000 hectares of mangroves in Bynoe Harbour and describes ten main mangrove associations or communities. The data provides a basis for identifying the extent and distribution of mangrove communities for Bynoe Harbour and its environs. Mangrove mapping was updated over this area in a 2016 survey. See metadata record for Mangrove Community Mapping - Charles Point to Gunn Point. www.ntlis.nt.gov.au/metadata/export_data?type=html&metadata_id=87F656131848A609E050CD9B214417E1